Returns Make the Reuse World Go ‘Round
A Case Study Analysis of Reuse Systems and Return Rates
Please return me. I’m reusable.
I’m reusable. Return me.
Sip. Return. Repeat.
Use me baby, one more time.
The labels on reusable returnable cups and containers range from succinct to cheeky and everything in between, but the message is the same: return this packaging. Without returns, a reuse system isn’t a reuse system, it’s a very expensive single-use pipeline.
As reuse pilots scale and become long-term and permanent projects with embedded infrastructure, reuse leaders are asking: what is the best system for ensuring high return rates?
Is it necessary to provide an incentive for return, or a penalty for not returning containers?
Deposit or no deposit?
Does tracking the containers actually help in getting them back?
Fortunately, the reuse movement has been testing these waters for long enough that we have a relatively robust portfolio of case studies to point to some answers.
Open Loop Systems: Consumers check out containers from one or more locations within a wide geographic area that does not have contained entry and exit points. The reusable packaging leaves the site of purchase. Example: coffee shops participating in a citywide reusable cup program, where cups can be checked out and returned at any participating shop.
Closed Loop Systems: Consumers check out and return containers within an enclosed area with set entry and exit points. The reusable packaging stays on-site. Examples: a sports stadium or a gated outdoor event.
With at least half a dozen citywide reuse systems in the works across the US and Canada — and more on the way — reuse is upping the ante. With scale in mind, we analyzed the data from case studies of large volume sports and entertainment venues, festivals and events, university takeout systems, and citywide takeout systems to help shed some light on the best way to ensure high return rates of reusable foodware. In order to gather as much data about high-volume pilots and projects as possible, we took into account both open and closed loop systems.
The kinds of systems implemented in the studies divide into two primary categories. The first category includes systems that impose some form of deposit, fee, or incentive to compel returns. The second category includes systems that rely simply on messaging and labelling to ensure returns, with no financial commitment or risk required of the consumer.
Systems in the first category yielded a return rate of 96%, while systems in the second category saw a return rate of 86.17%. The table below provides further breakdown of the analysis.
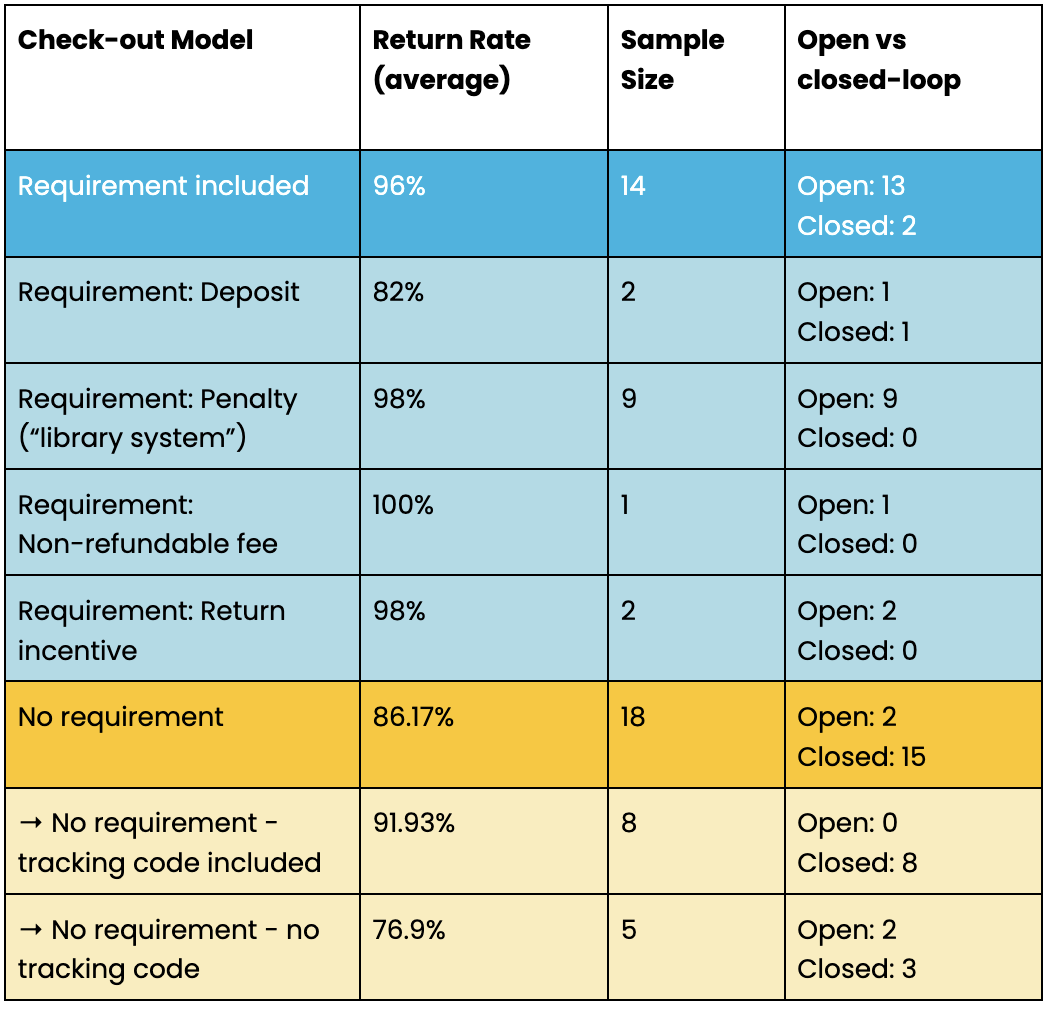
Note: The non-refundable fee system is implemented at Seattle Pacific University, where students pay a one time fee of $5 to check out containers for their duration on campus. Average return rates without this case study are 95%. Two colleges — Christopher Newport University and College of Wooster — incentivize students to return containers with raffles and rewards systems.
Simply including a tracking code on a container — with no deposit or penalty — appears to signal to consumers that the container should be returned: containers with QR codes included on them saw a 91.93% return rate while those without saw only a 76.9% rate. (Incidentally, we’ve heard this confirmed by reuse service providers.) That said, it is important to note that all of those containers with tracking codes were also circulating in a closed-loop system, where it is easier to collect containers. (Five case studies in the second, no-cost requirement category did not indicate if a QR code was included on the container).
While it’s easy to conclude from a high-level glance that including a financially-bound requirement to return a container is the way to go, this data set is just the beginning of the story. While 32 case studies is a sizable number, once they are broken into categories — and segmented into open versus closed loop systems — it’s clear we need more data. Also, context matters. Every other part of the system — from collection bin placement, to messaging, to considerations of whether the reuse system is opt-in or the default choice — also affects return rates.
One thing we do know anecdotally from many reuse leaders who have run pilots and projects? No matter what, check-out and return of reusable containers must be simple and seamless. No one likes to lose money on a deposit or lost container fee. But at the end of the day, for most people, convenience will outweigh all other considerations (unless the fee is quite high: Reuse Ottawa, for example, imposes a $10 non-return fee and has thus far seen close to 100% return rate).
We’re hearing more questions, ever more nuanced, as reuse proliferates.
What happens when you layer return incentives — like a raffle entry or free drink — on top of a deposit or penalty?
Have any venues conducted A/B testing in order to have a true apples-to-apples comparison of return systems?
Does a successful system in one locale or sector map cleanly onto a different locale or sector, where behaviors may vary?
Overall, we’ve built a solid body of knowledge to start drawing insights from. We’re already amassing the data necessary to inform larger scaled projects and help ensure their success. But it is important to keep pooling this data for the benefit of the entire reuse movement. That’s why Upstream has developed Chart-Reuse® — an ecosystem of projection tools, reporting tools, robust databases, and shared benchmarks. We’re working to build the evidence base the entire movement needs to design better systems, secure funding, and scale reuse with confidence.
We repeatedly say that the key to a robust reuse economy is widespread, shared, interoperable infrastructure. And the key to building effective infrastructure is widespread, shared data and insights grounded in real-world experience.
Got a reuse case study for us to add to the Case Study Database? Submit it!
About the case studies
Case studies for this analysis were pulled from Upstream’s Case Study Explorer, in the categories of Sports & Entertainment, Festivals & Events, Universities, and Takeout Dining (e.g. all foodware-based categories that are not K-12 school systems). Studies that did not list return rates were not included.
Case Studies
Sports & Entertainment
Universities
Christopher Newport University
University of Southern California
Takeout Dining
Seacoast New Hampshire Reusable Takeout Container Pilot
Festivals & Events