Upstream’s foodware reuse analytics tool, Chart-Reuse®, recently helped a metropolitan cultural attraction figure out how much they would save by switching to reusable foodware for their concessions. The results are in: reusable foodware saves money, emissions, and water.

The data below represents projections of reuse impacts and costs, and makes educated assumptions about reuse service provider equipment, fees, routes, etc.
The Status-Quo Single-Use System
Currently, this cultural attraction…
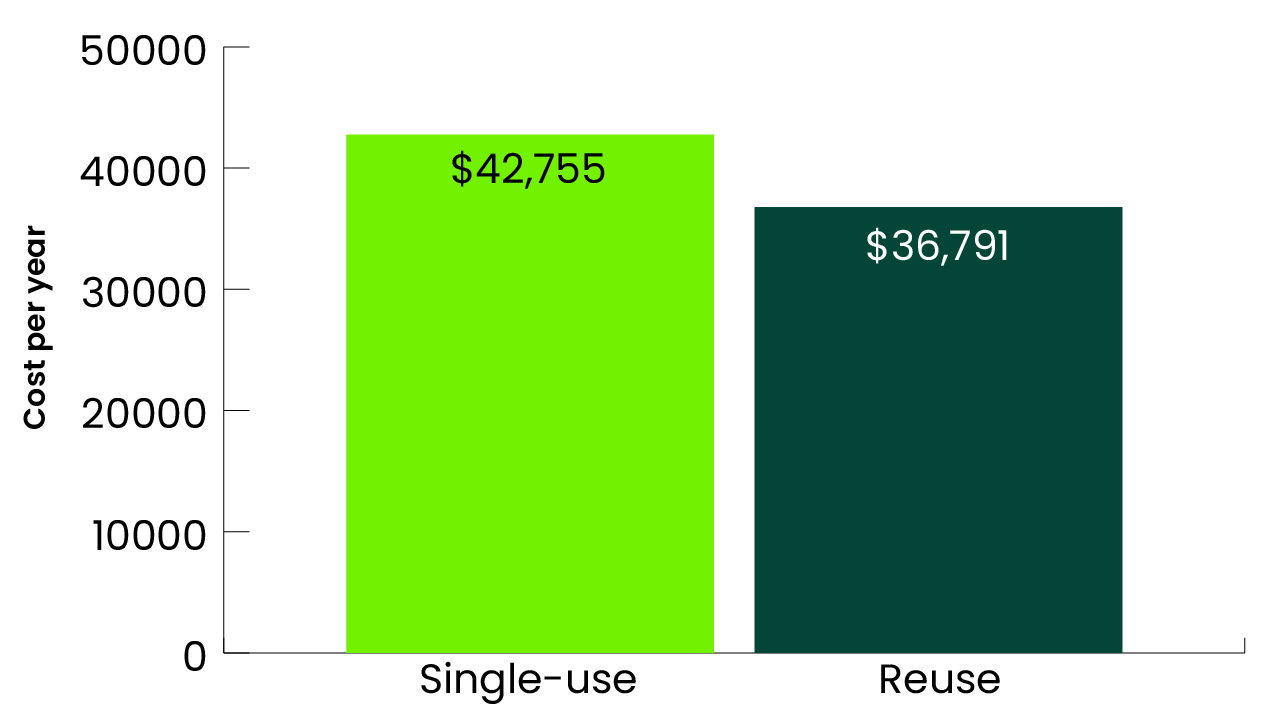
spends over $42,000 each year on single-use foodware.
uses over 691,000 single-use items annually.
runs a total of 394,461 transactions per year, which averages to between $0.11-1.68 worth of single-use items per transaction.
The attraction uses over 691,000 single-use items in one year. Laid end-to-end, these items would stretch as long as 12,340 triceratops!

How much waste could a reuse system prevent?

By switching all single-use foodware items to reusables, this venue could reduce their waste generation by 5,635 lb per year.
That’s a waste reduction equivalent of about 28 adult pandas!

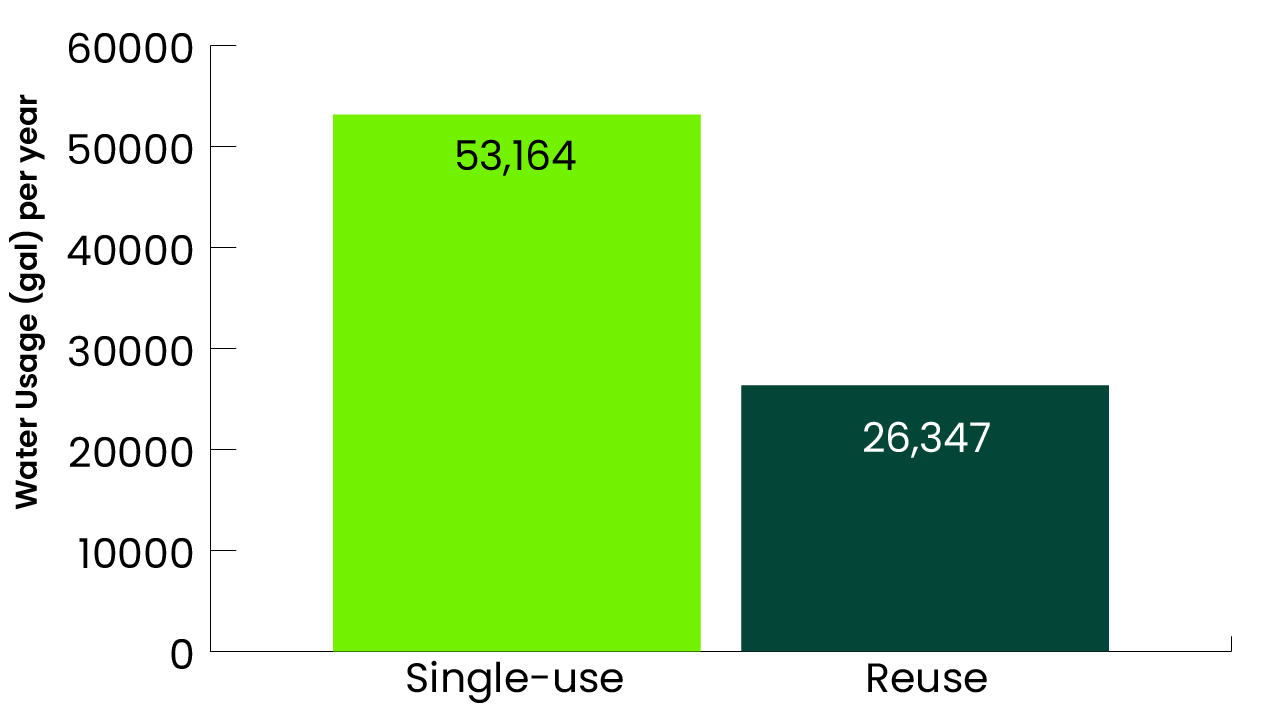
How much water could a reuse system save?
A common misconception about reuse systems is that they are more water-intensive because they require dishwashing.
However, the upstream water usage from the mass consumption of single-use items almost always consumes more water than reuse.
In this case, a swap to reusables could result in 26,817 gallons in water savings each year.
That’s the water savings equivalent of 2,000 showers!

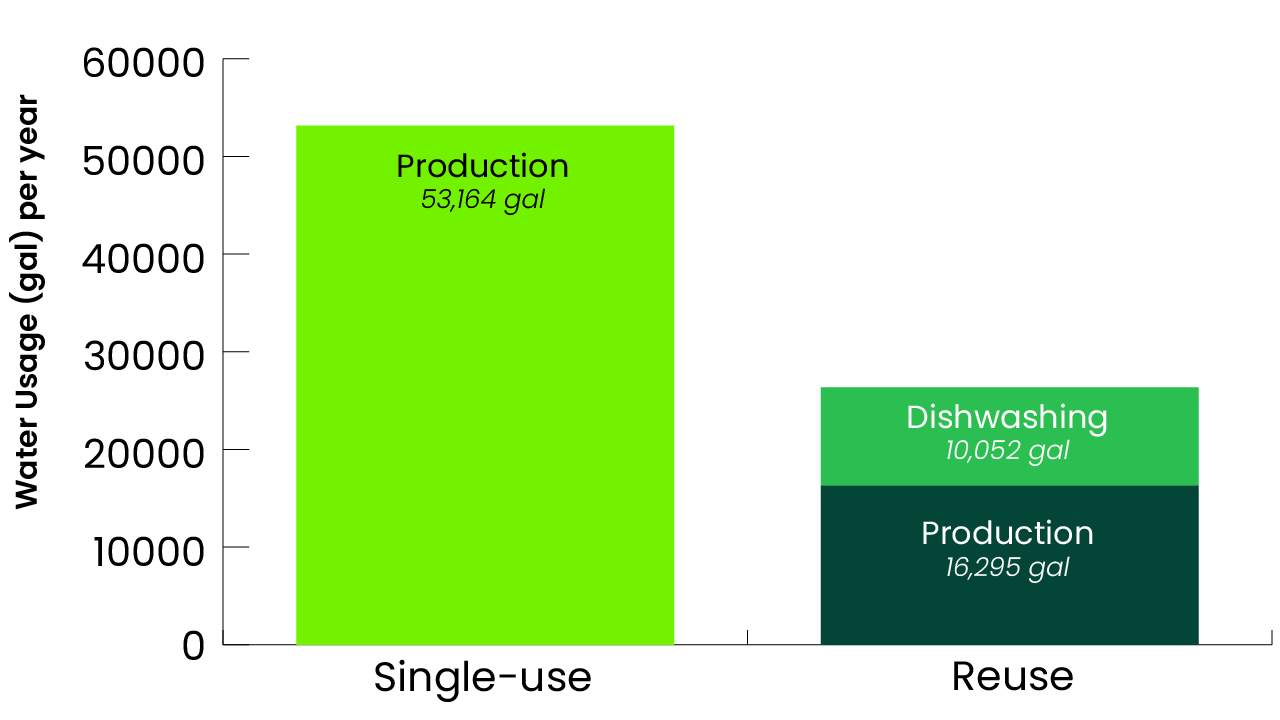
Upstream foodware production processes use more water than dishwashing for both single-use and reusable foodware.
What are the potential greenhouse gas savings from switching to reuse?
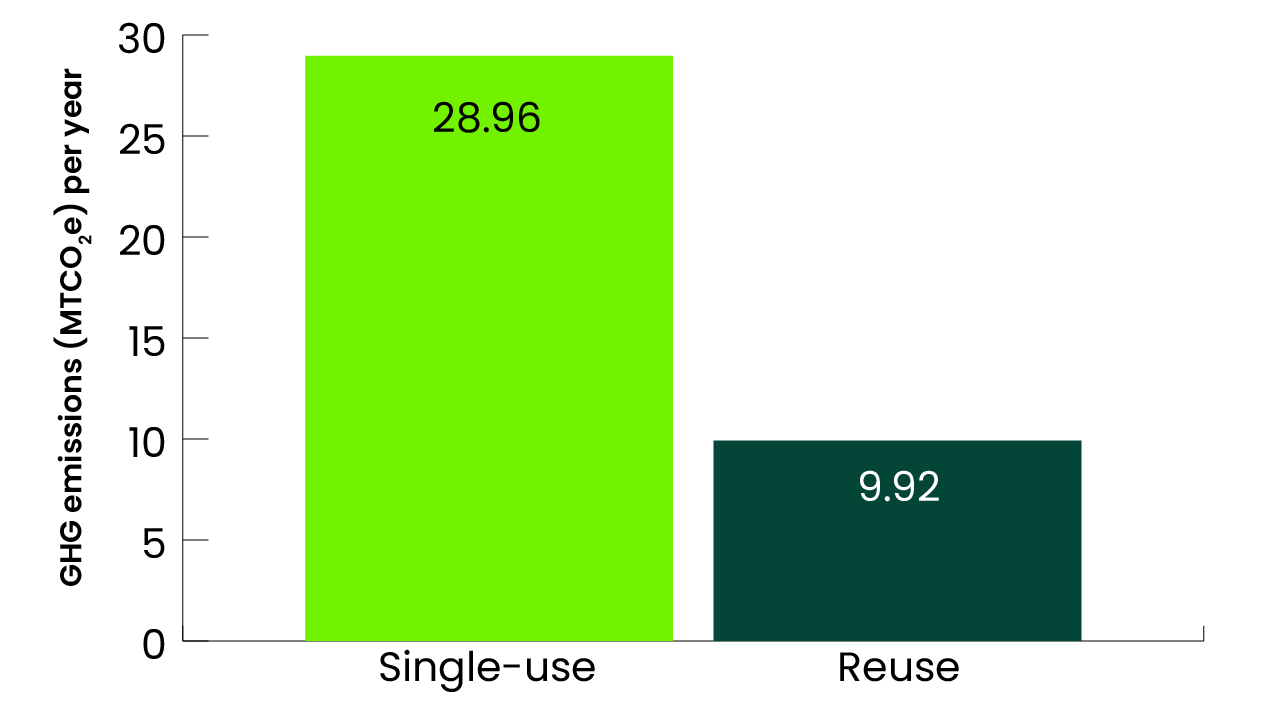
Reuse could result in 19.43 metric tons in carbon savings per year.
This is the carbon equivalent of taking 5 cars off the road for a year.

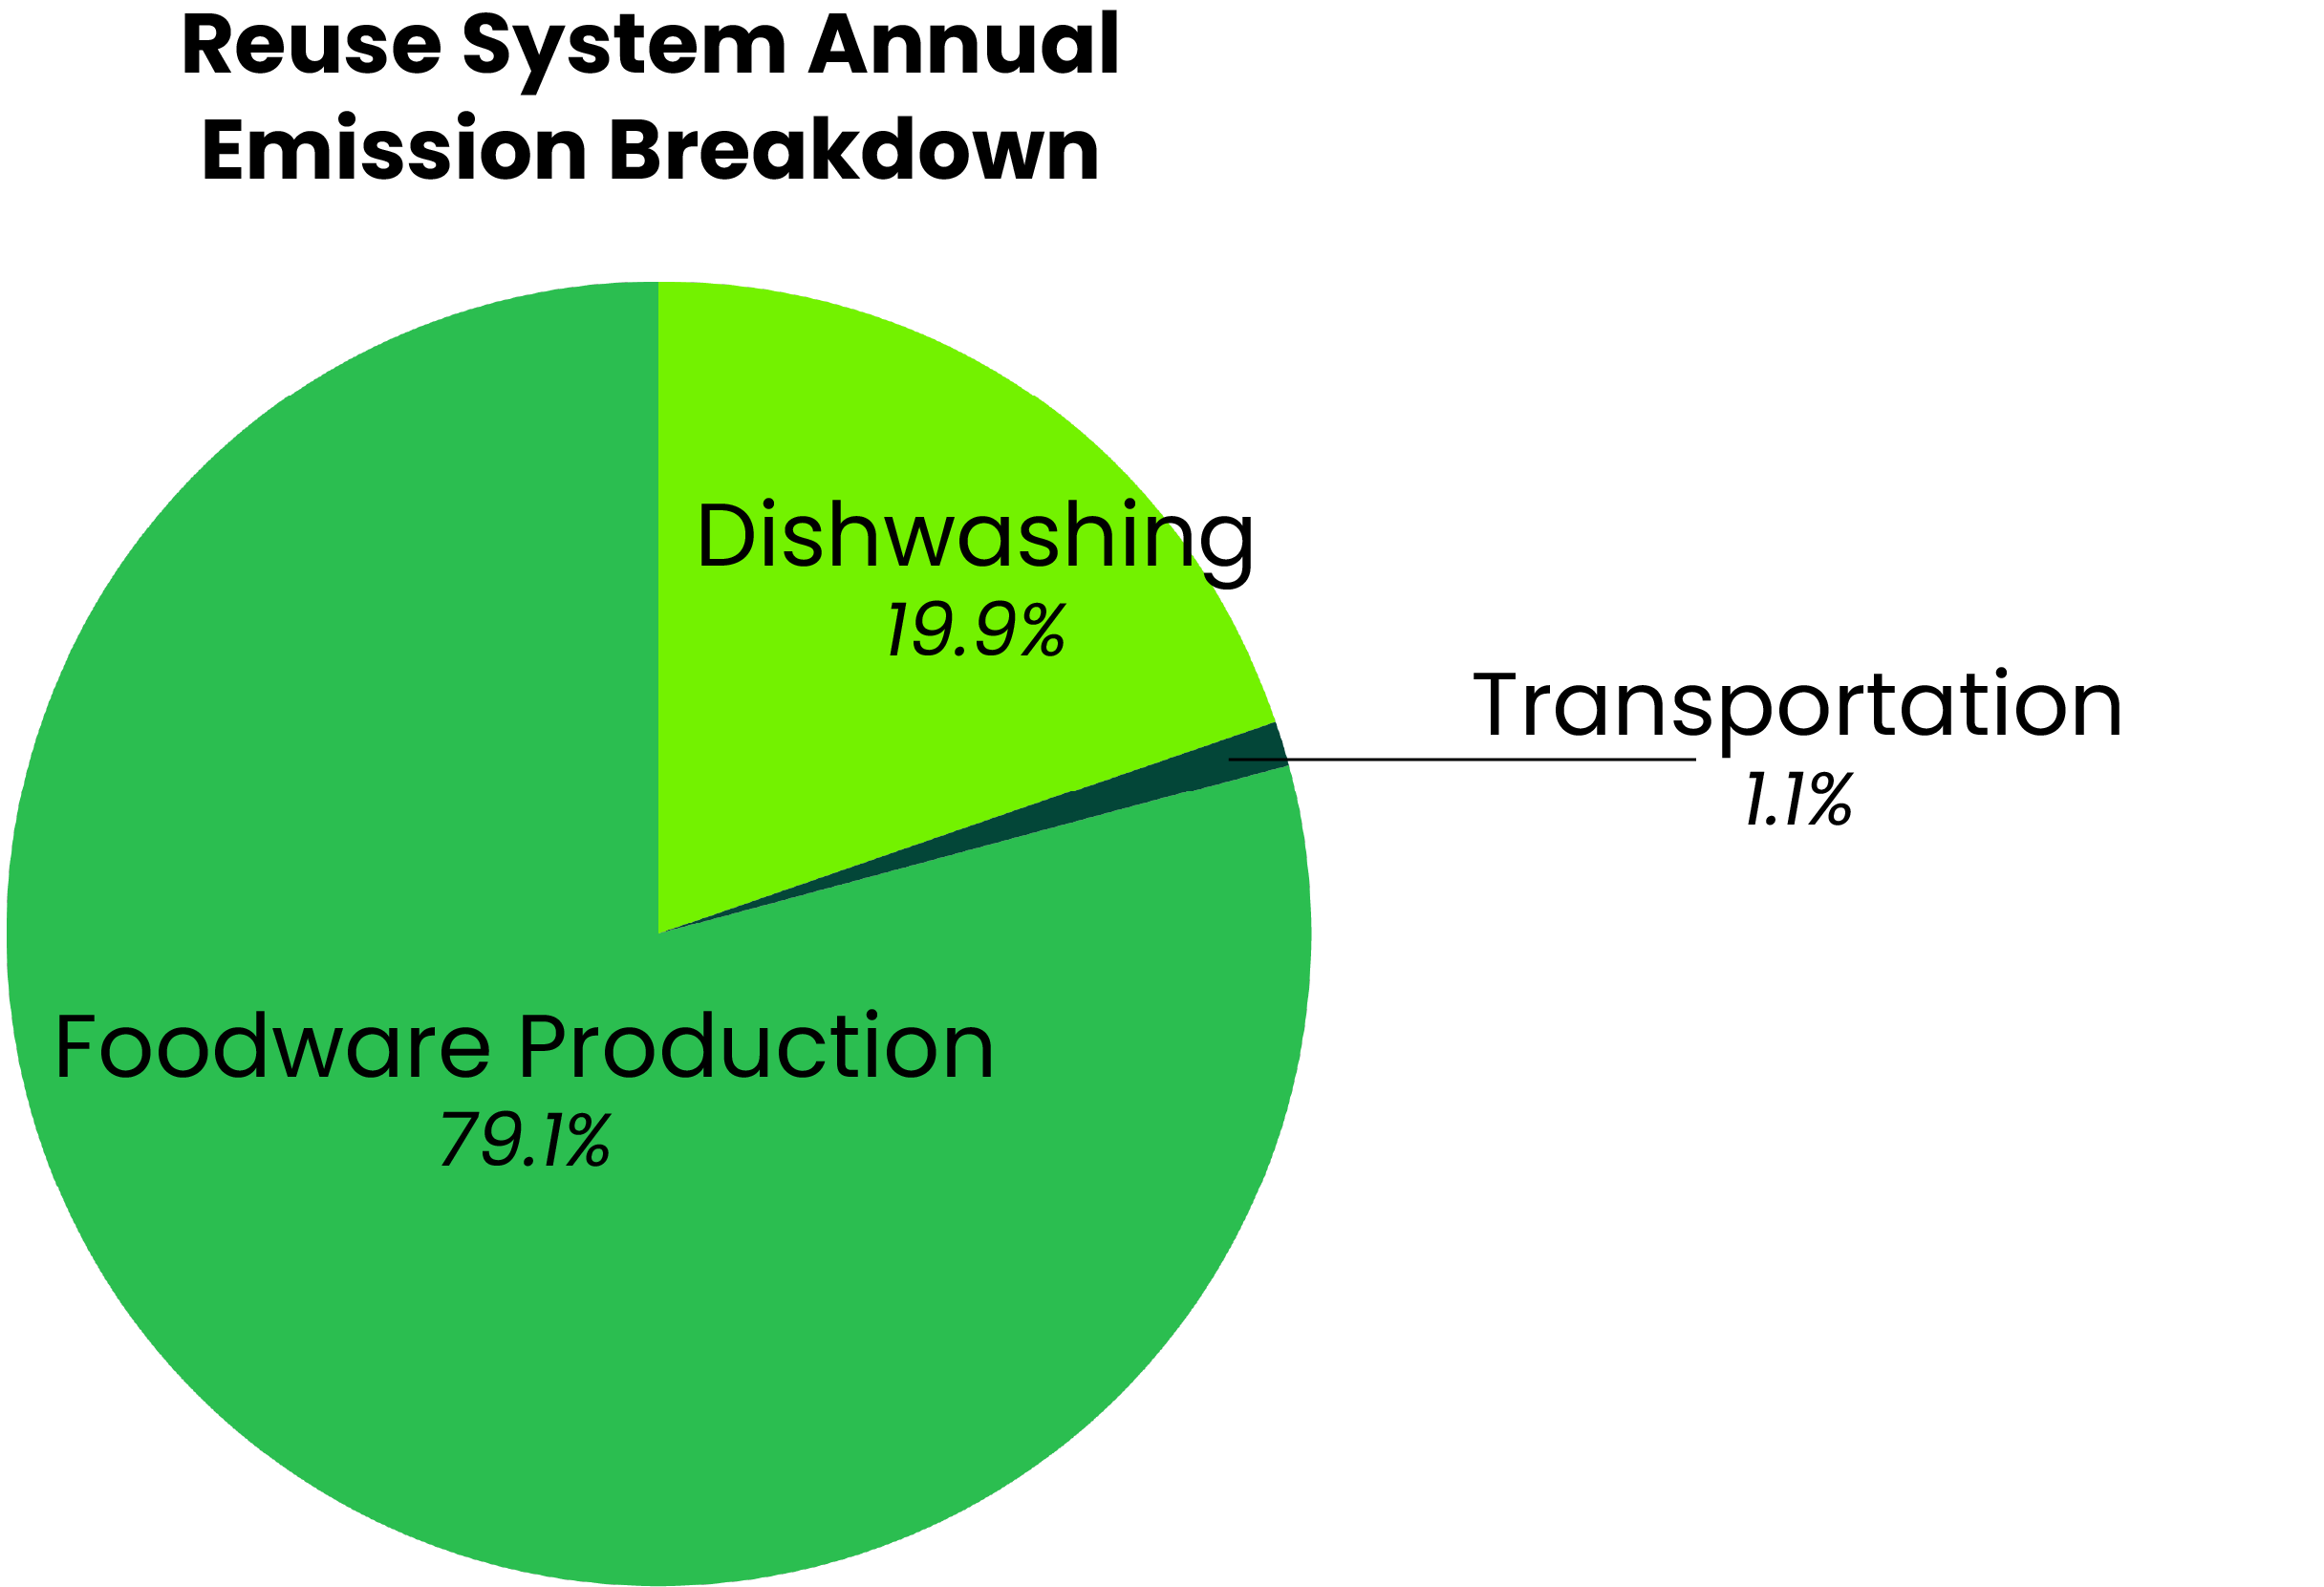
What about transportation? N.b.d.
In this scenario, the cultural attraction will hire a reuse service provider to wash the foodware at an off-site wash hub. This modeling scenario assumed a local wash facility was in close proximity to the venue, and that the collection route was optimized to include a shared, full cargo load of reusables. With these considerations, transportation only accounts for 1.1% of the full emissions of the reuse system.
Transportation assumptions:
Assumes vehicle has a full cargo load and is being used for other collection services simultaneously
Assumes 15 miles per round-trip route
What are the potential cost savings of switching to reuse?
Using a deposit-return scheme, which ensures a higher return rate, and assuming a 5% loss rate, plus the cost of dishwashing, the reuse system will save almost $6000.

What are the environmental benefits of venue events switching to reuse?
This cultural site hosts 66 events that rely on single-use compostables. Each event has an average of 153 attendees.

What’s next?
Proving the case for reuse is great, but actualizing the system is the real goal. After Upstream conducted this analysis, we connected the cultural venue with a local reuse service provider so that they can explore a partnership to help the venue can meet its sustainability goals.
To learn more about Chart-Reuse® and see more case studies, visit www.chart-reuse.eco.
Sources:
Upstream Solutions. (2024). Chart-Reuse.
U.S. Environmental Protection Agency. (2019). Waste Reduction Model (WARM), Version 16. Source Reduction Pathway.
U.S. Environmental Protection Agency. (2024). Greenhouse Gas Equivalencies Calculator. https://www.epa.gov/energy/greenhouse-gas-equivalencies-calculator
U.S. Environmental Protection Agency. (1997). Volume to Weight Conversion Chart. https://archive.epa.gov/wastes/conserve/tools/rogo/web/pdf/volume-weight-conversions.pdf
U.S. Environmental Protection Agency and U.S. Department of Energy. (2024). CFS Equipment Calculator. Version 3.0. https://www.energystar.gov/sites/default/files/2024-03/CFS%20Equipment%20Calculator.xlsx
U.S. Environmental Protection Agency. (2014). Emission Factors for Greenhouse Gas Inventories. https://www.epa.gov/sites/default/files/2015-07/documents/emission-factors_2014.pdf
Single-Use Material Decelerator (SUM’D). “Understanding Packaging (UP) Scorecard Methodology.” Version 1.0. March 25, 2025. URL: https://upscorecard.org/methodology-document DOI: 10.5281/zenodo.14881539